40x

ROLE: AR Developer
TIMELINE: 2 weeks
SKILLS: UX Design, Unity, Vuforia
TEAM: Cara Neel & Maya Pruitt
EXHIBITIONS: ITP Winter Show (December 2019)
40x is an augmented reality data visualization that illustrates the lack of affordable housing in the Lower East Side.
Can visualization make data more human?
BACKGROUND
New York City is becoming progressively more unaffordable affecting low-income populations the most. With property management companies requiring renters to have an annual income of forty times their monthly rent, nearly half of NYC households are rent-burdened, meaning that at least 30% of income is spent on rent.
40x serves to bring light to this issue, highlight the impact of these numbers, and start a conversation.
RESEARCH & IDEATION
As New Yorkers ourselves, Cara and I are no strangers to the cost of living in NYC.
We began researching neighborhoods ranked highest in unaffordability such as Long Island City, Williamsburg, and the Lower East Side. We were especially struck by how wealthy neighborhoods often existed adjacent to these areas despite the disparity in income. With rules like 40x in place (80x if using a guarantor), neighborhoods considered “affordable” are those that are more affluent.
We compiled population, income, and rent cost data from multiple sources and averaged them to create the LES dataset that we would use for this project.

Affordability map visualization by Curbed
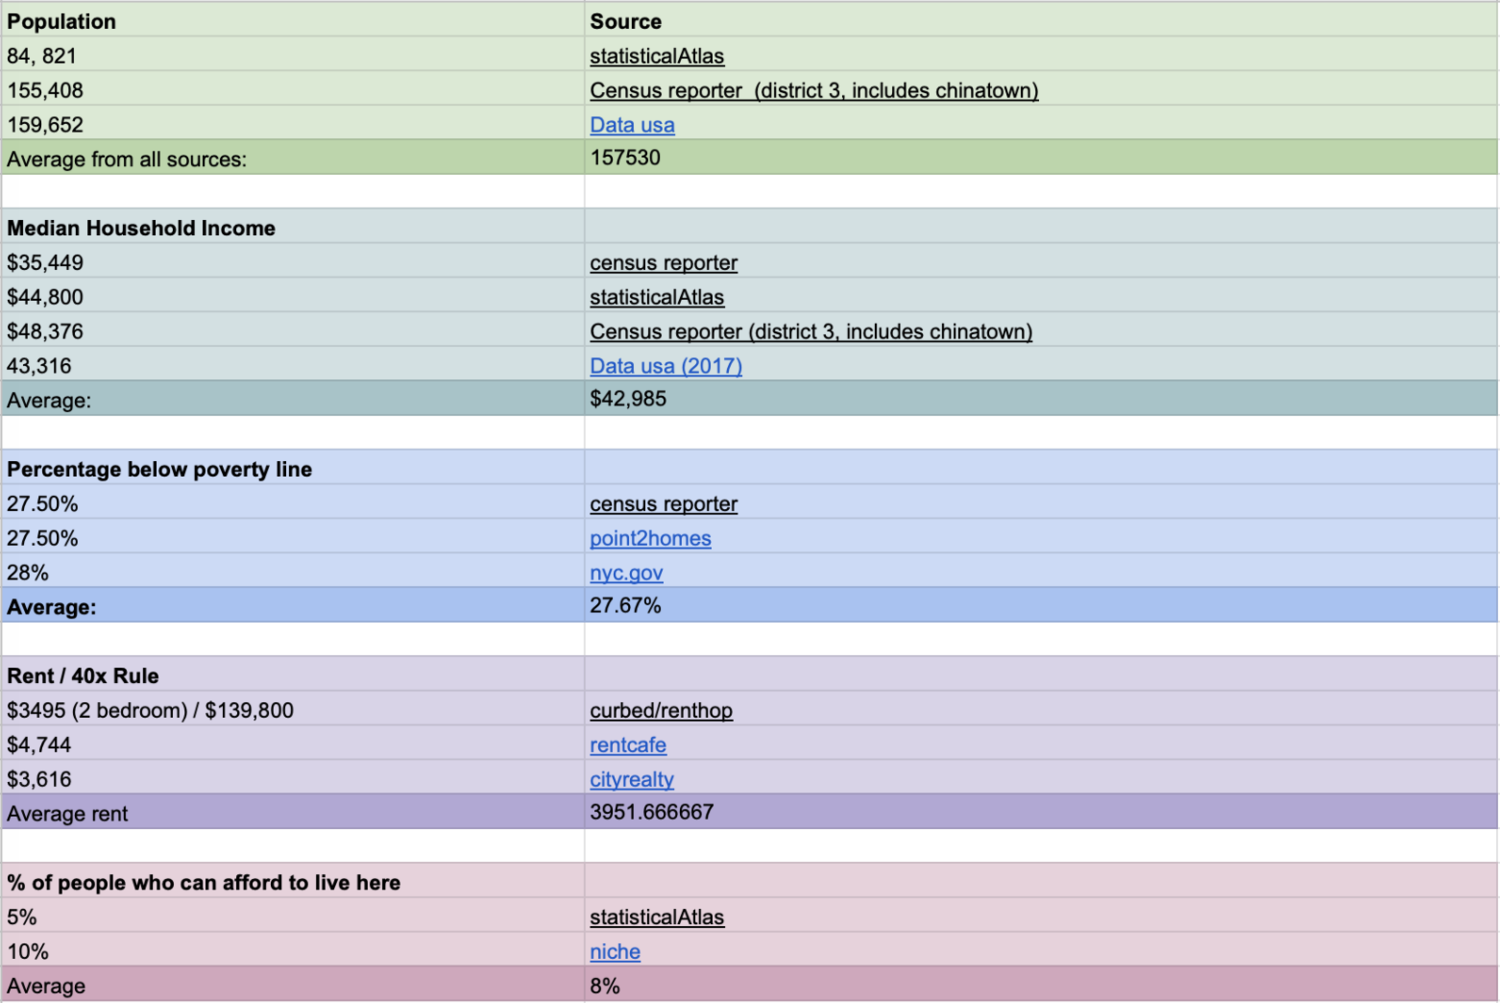
Synthesized chart of researched statistics
To illustrate the stark contrast between LES median household incomes and rent costs, we wanted to visualize the total population and then reduce its size to the remaining 8% of residents that can actually afford to live there. We would also create an interface to deliver written explanation of the dataset.
DEVELOPMENT
Using AR as the medium, our data visualization could intervene public space in a way that was legal, unobtrusive to the citizens of LES, and in a form not easily destroyed.
ITERATION: EXPLORING DATA IN DIFFERENT WAYS
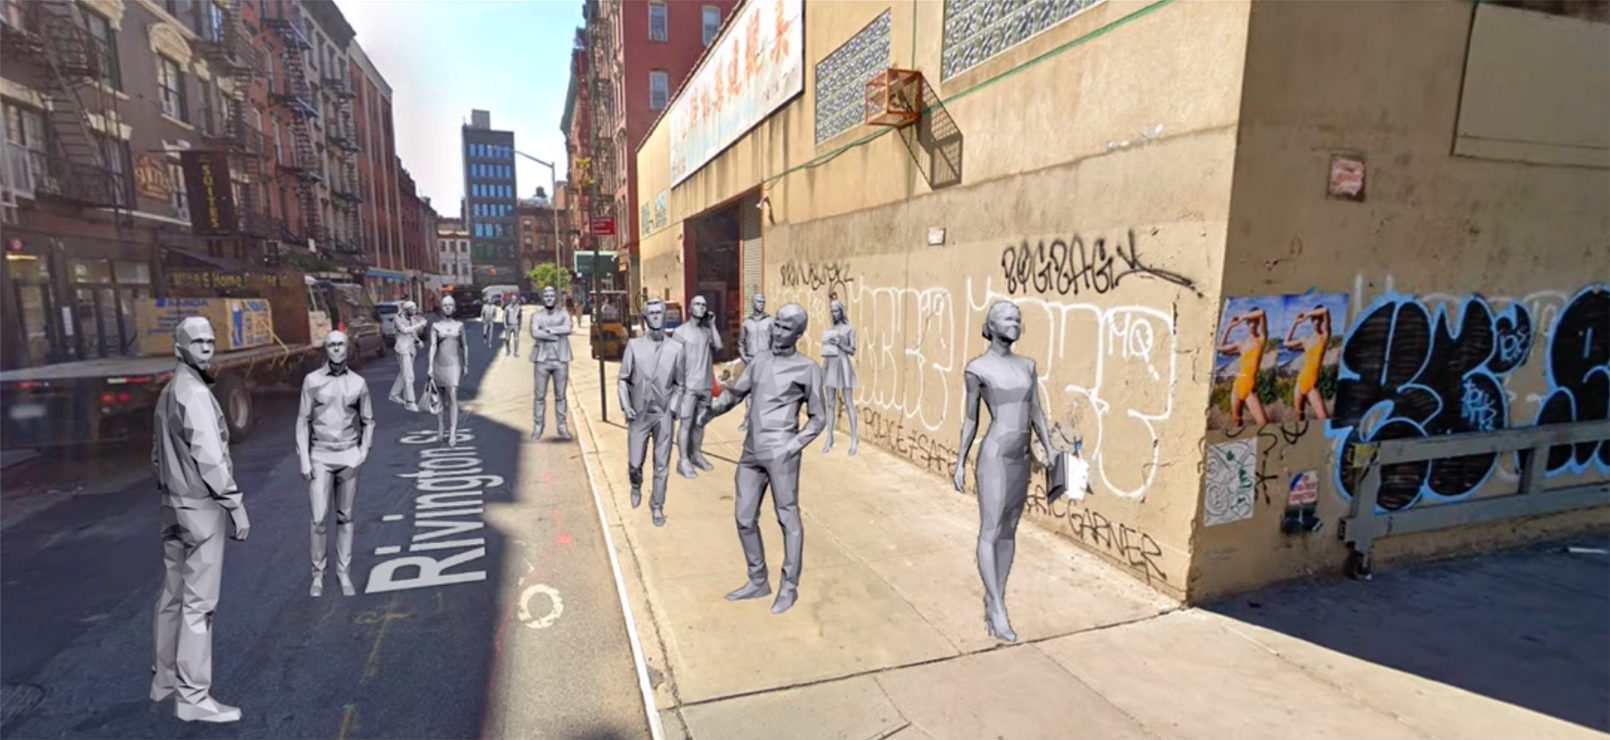
Version 1 - World Scale AR On-Location
3D low poly models of people appear at life-sized scale on a LES street. Their aesthetic makes them visually distinctive from people passing by. I developed the AR in Unity to recreate Cara’s high fidelity wireframe. This involved plane tracking to spawn the physical crowd, animation of the disappearing people, and programming UI elements.
UI Design by Cara Neel


Translation into an AR application by Maya Pruitt

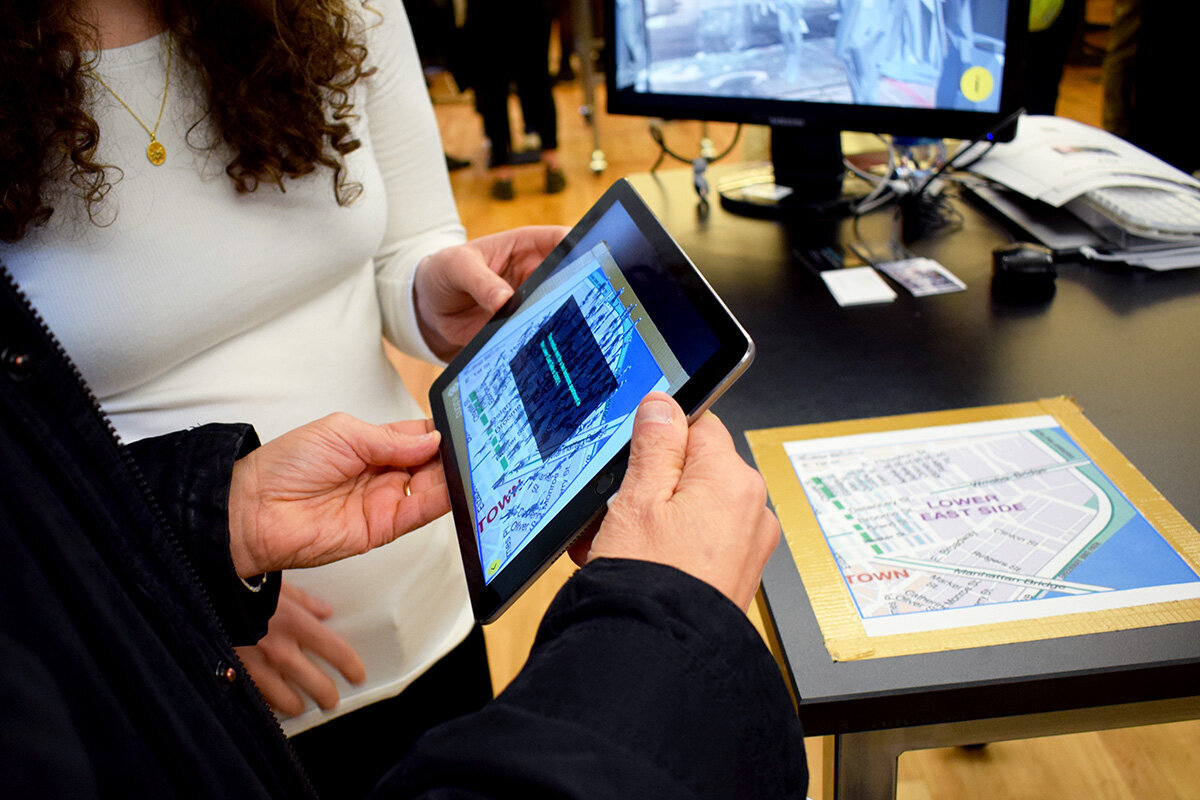
Version 2 - Table Top Image Targeting
Using a map that can be placed anywhere, this version shrinks the scale to allow you to see the entire population at once.

Animation test in Unity

Image target test
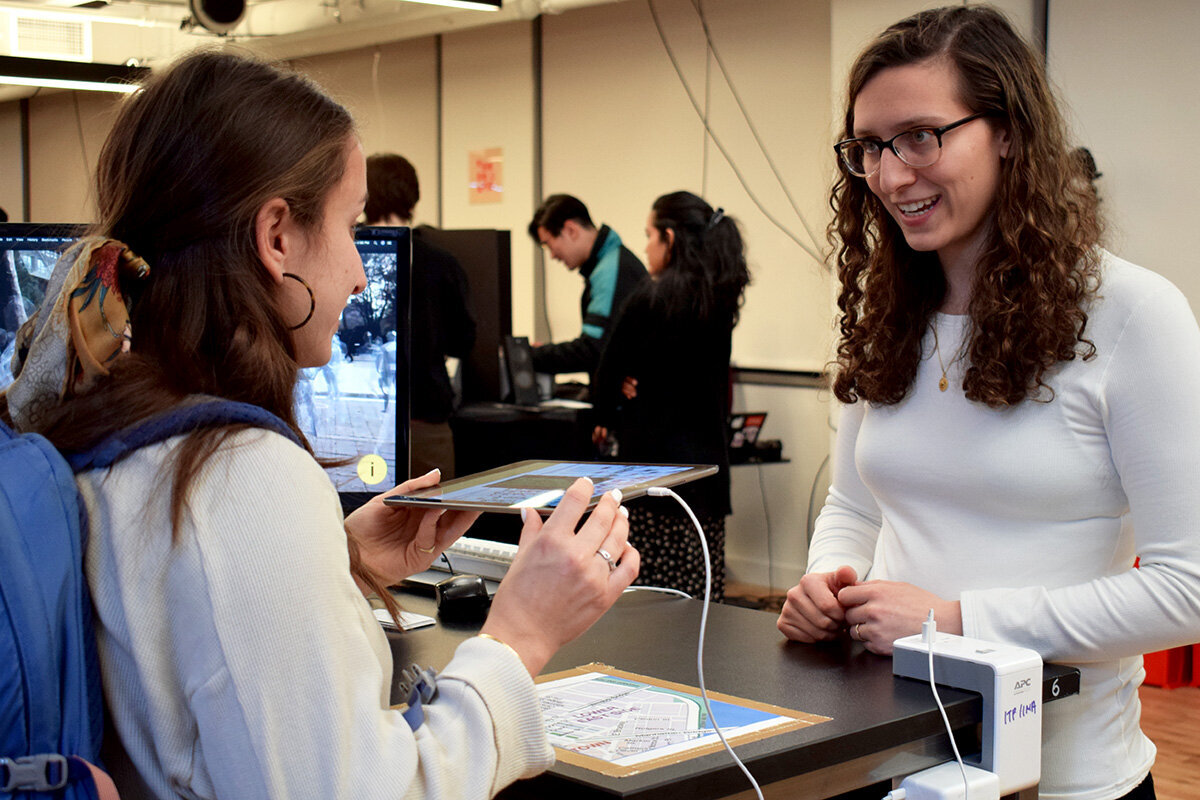
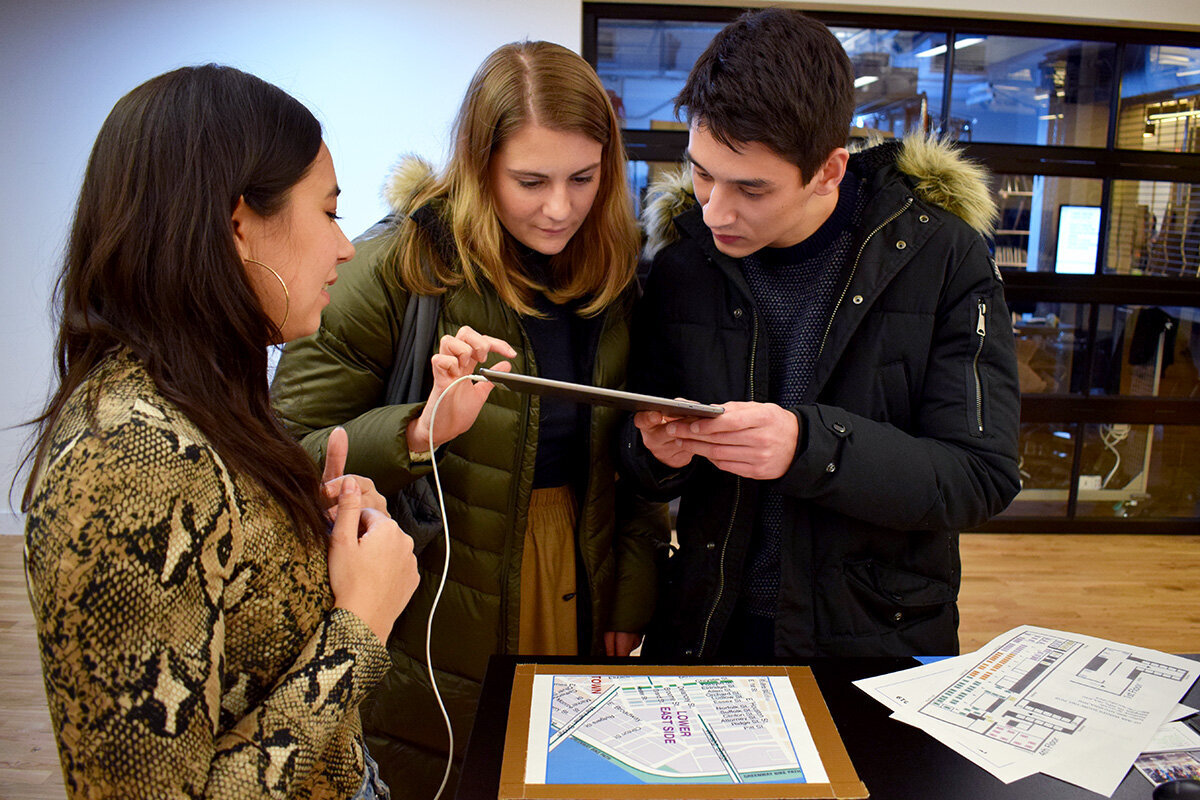
USER TESTING


FINAL PRODUCT

Video demo: World-Scale AR