RESEARCH
As New Yorkers ourselves, Cara and I are no strangers to the cost of living in NYC. We began looking at articles covering rent costs and income levels of different populations throughout the city. We were especially inspired by a Curbed article entitled, New York’s most and least affordable neighborhoods and its supplemental map visualization. We were especially struck by how wealthy neighborhood and low income neighborhoods can exist right next to each other with such a disparity in income.
Areas like Long Island City, Queens, Williamsburg, Brooklyn, and the Lower East Side ranked among the highest for unaffordability. We decided to delve deeper into the Lower East Side as we are both Manhattanites living nearby LES and felt a more initial personal connection.
From maps like these it was fascinating to see that neighborhoods considered “affordable” are actually those that are more affluent. The rents are still high, but because median income is higher, those living in these neighborhoods can more easily cover their rent payments. This lead us to researching more about the 40 times rule, requires renters to have annual incomes of 40x the monthly rent in order to lease apartments in NYC. If an individual cannot meet this requirement they are expected to have a guarantor who makes 80 times your monthly rent.
We compiled population, income, and rent cost data from multiple sources and averaged them to create the data set we would use for this project.
Table of our calculations.
Annal household income data from censusreporter.org
Chinatown & LES statistics from datausa.
Our conclusions:
Median household income: $42,985
Average rent (2 bedroom apt.): $3952
40x rule projected income: $158,080
The LES population with an income bracket of $158,080 only represents 8% of the total population.
Household income brackets by population from statistical atlas.
PROCESS
Cara and I were interested in creating a piece to intervene in public space. However, it was important to us that our intervention was legal, unobtrusive to the citizens of LES, and in a form not easily destroyed. We felt that augmented reality gave us the affordances of these considerations.
40x is built in Unity. In our design we wanted to use low poly 3D models to create the sensation of a crowd but also have them visually distinctive from people passing by. Our decision to have the people fade out slowly overtime was meant to create visual impact of the statistics we had researched. We also wanted to include written explanation of our research presented in a familiar form and in a way that could be toggled through at the user’s own pace.
Cara developed a wireframe of the design. I worked in Unity to build the AR and UI elements. Below is a test of the crowd animation using an image target.
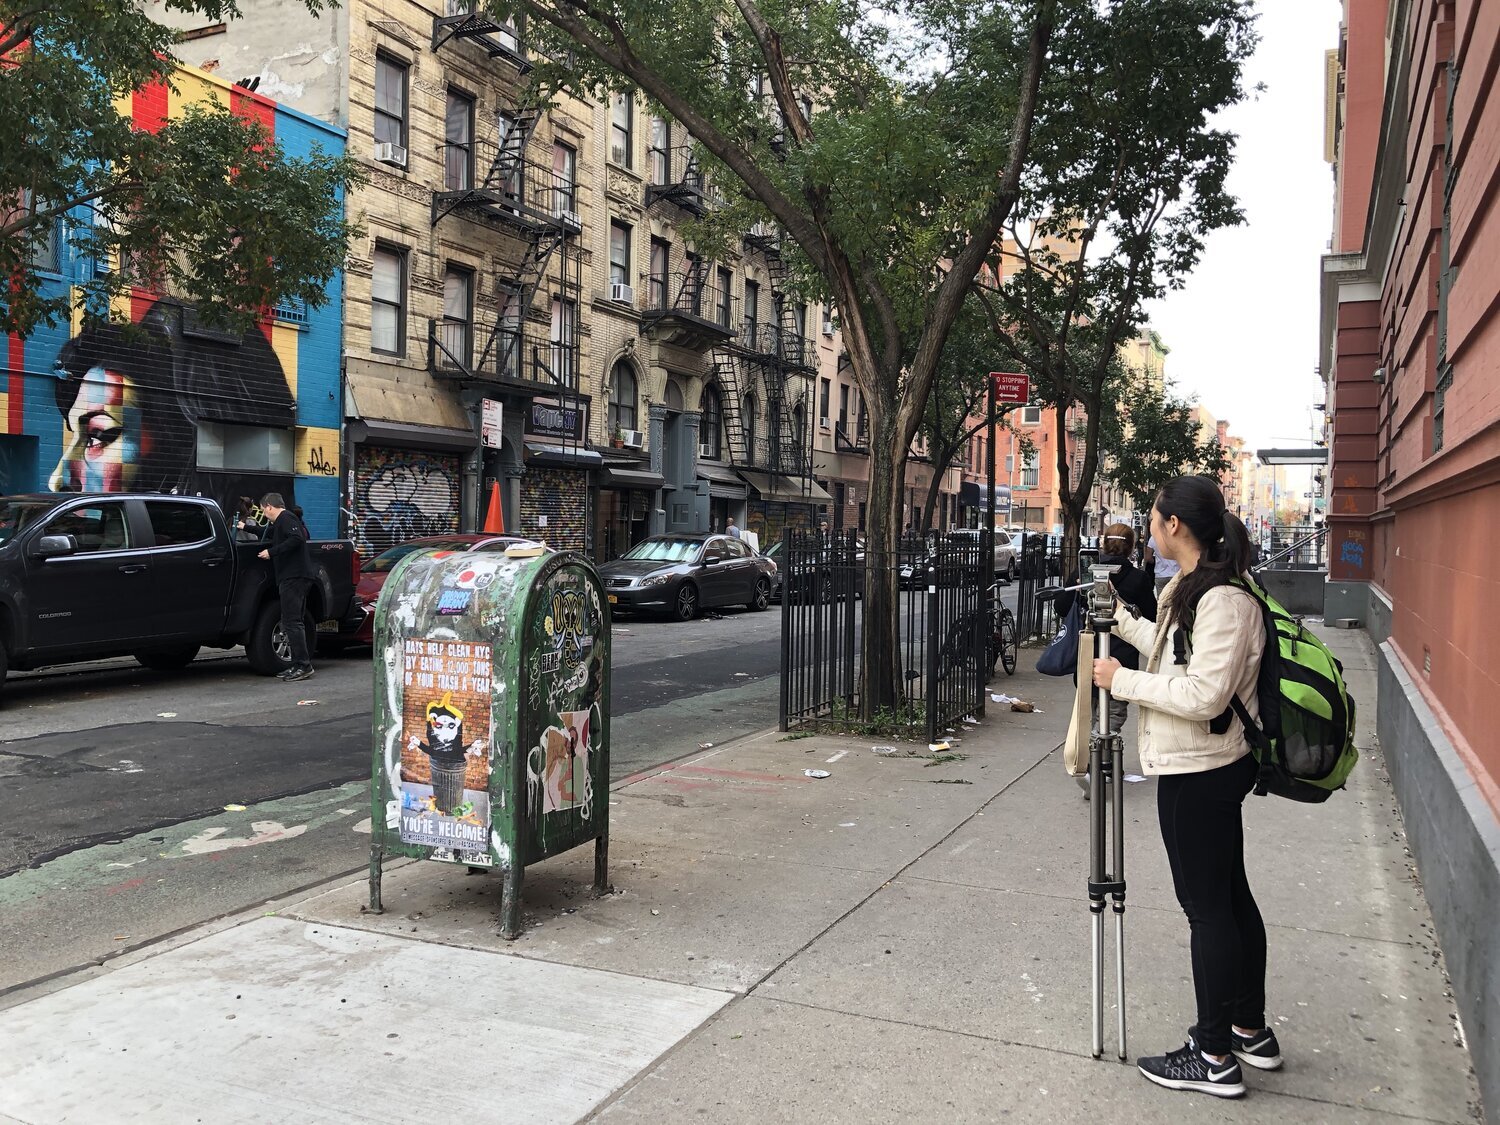
Documentation of 40x was shot in the Lower East Side.


